
Individual Visualization of Key Production Indicators from Cosmino MES − New Whitepaper Shows Examples with Various Graphic Tools
By Matthias Kohlbrand In Using Cosmino DynaMon the collected data becomes transparent key production indicators. This facilitates the overview of the status of individual machines up to plants and enables timely intervention. The standardized reports create transparency and prevent discussions, moreover they are easy to create.The new two interfaces REST and MQTT allow Cosmino-own visualizations as well as a possibility to connect additional graphic tools - such as Grafana©, NodeRED©, Power BI© or Jaspersoft© - to display these key production indicators. Thus the visualization possibilities are almost unlimited.
Additional information about the new interfaces and visualization examples can be found in the new whitepaper: "REST & MQTT Interfaces. Darstellen und Weiterverarbeiten berechneter Produktionskennzahlen". (At present, only available in German.)
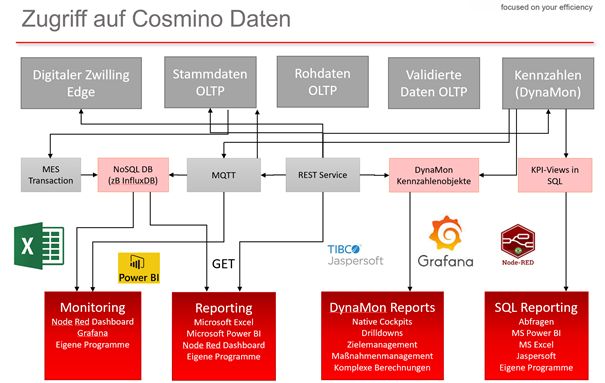
Fig.: Different Cosmino MES data sources are preferred depending on the application
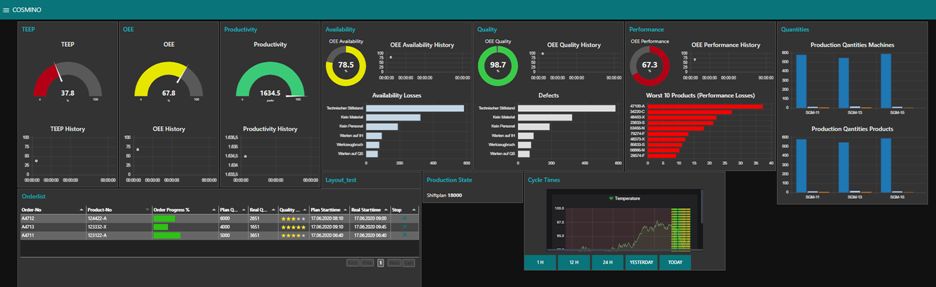
Fig.: Cockpit with various real-time key production indicators and histories